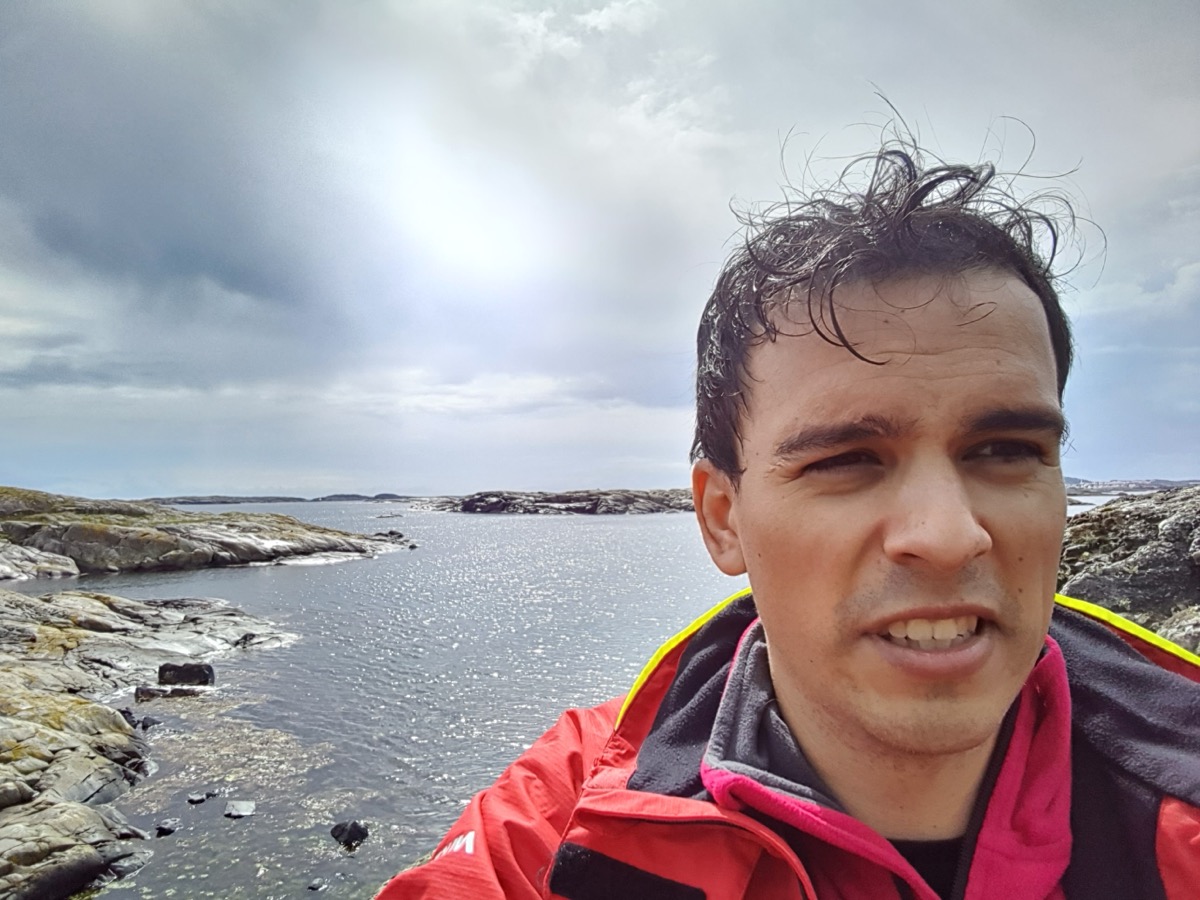
Hi, I'm Erik.
I build data pipelines, dimensional models, and reporting, mostly in Microsoft Fabric and Power BI.
I work as a Data Engineer and BI Developer at Rejlers. Before that, I spent eight years at IVL Swedish Environmental Research Institute, mostly on sustainability analysis of products central to Europe's green transition, such as batteries and magnets. Along the way I did REACH compliance reporting for a manufacturer and built a Python optimization model for a battery recycling network.
My Approach
The work usually starts where a spreadsheet stopped scaling.
Start with the end report
Design data systems backwards from what stakeholders need to see and decide. Reporting built from their own questions is reporting they use.
Automate what repeats
Find the manual steps that take time every cycle and automate them, so the next cycle is a refresh, not a rebuild.
Build for audit trails
Every number traces back to its source, with completeness checks built in. That is what makes a figure defensible when someone asks where it came from.
Document for the next person
Create systems that others can maintain and extend, not black boxes only you understand.
Background & Credentials
Experience
- Eight years at IVL Swedish Environmental Research Institute (2018–2026)
- EU-funded research projects (ELiMINATE, SIREN)
- Multi-year engagement for a Fortune 500 automotive manufacturer, under NDA, via IVL
- Contributed to 40+ research and consultancy projects as analyst, LCA practitioner, and project leader
Certifications
- Microsoft: Fabric Data Engineer Associate (DP-700)
- Microsoft: Fabric Analytics Engineer Associate (DP-600)
- Microsoft: Azure AI Fundamentals (AI-900)
- Microsoft: Power BI Data Analyst Associate (PL-300)
- Microsoft: Azure Fundamentals (AZ-900)
- University of California, Davis: SQL for Data Science
- Google: Data Analytics Certificate
Technical Stack
- Data: SQL, Python, Power Query / M, PySpark, Microsoft Fabric, Power BI, Azure SQL Database
- Practices: Dimensional modeling (Kimball), medallion architecture, ETL/ELT, Git, unit tests in GitHub Actions
- Analysis: Lifecycle Assessment, Optimization Modeling
- Domain: Regulatory compliance
Research & Publications
Academic research and reports from collaborative industry projects.
Optimizing Resource Recovery of Lithium-Ion Battery Recycling
Material flow analysis and reverse-logistics network optimization for end-of-life lithium-ion batteries in Europe up to 2030, comparing recovery technologies on cost and CO2 (C801 Report).
Plastics in Passenger Cars
Analysis of plastic materials usage in passenger vehicles and implications for recycling and circular economy (C454 Report).
Lithium-Ion Vehicle Battery Production
Meta-analysis of life-cycle energy use and greenhouse-gas emissions from lithium-ion battery manufacturing, revising the earlier 150-200 kg CO2-eq/kWh estimate down to 61-106 kg CO2-eq/kWh on the basis of commercial-scale production data (C444 Report).
When not building data pipelines, you'll find me hiking the Swedish west coast, reading about energy systems, or experimenting with new visualization techniques. The work I like best sits where technical rigor meets genuine curiosity about how a system actually behaves.
Interested in connecting?
I'm always happy to discuss data engineering and BI work, research collaboration, or just exchange ideas on modeling messy industrial data.
Get in touch