Lithium-Ion Vehicle Battery Production: Meta-Analysis of Emissions Data
Impact at a Glance
Conducted comprehensive meta-analysis of lithium-ion vehicle battery production emissions for the Swedish Energy Agency, synthesizing data from 15+ published LCA studies to update industry greenhouse gas emission benchmarks. Through systematic evaluation of newly available commercial production data, refined emission estimates from 150-200 kg CO₂-eq/kWh (2017 baseline) to 61-106 kg CO₂-eq/kWh, representing a 32-47% reduction as industry data transparency improved.
This 2019 research laid the groundwork for understanding battery production emissions—data now critical for EU Battery Regulation carbon footprint declarations and Battery Passport compliance. The process-level analysis and material flow methodology directly inform the carbon footprint calculation requirements mandated under the EU Battery Regulation (2023/1542).
1. Business Problem
As electric vehicle adoption accelerated globally, understanding the true environmental impact of battery production became critical for:
- Policy makers developing battery regulations and sustainability frameworks (now formalized as EU Battery Regulation carbon footprint requirements)
- Automotive manufacturers reporting lifecycle emissions and making sourcing decisions for regulatory compliance
- Battery producers benchmarking production efficiency against industry standards and preparing for Battery Passport reporting obligations
- Supply chain partners documenting emissions data for downstream compliance verification
Early estimates (2014-2017) relied heavily on pilot-scale facility data and theoretical models, resulting in wide ranges and high uncertainty. As the industry matured and commercial-scale production expanded, more transparent primary data became available, creating an opportunity to refine these estimates with real-world manufacturing data.
2. Analytical Work & Methodology
Literature Review & Data Synthesis
- Performed systematic review of LCA methodologies across scientific publications, industry reports, and standardization frameworks (Argonne National Laboratory’s GREET Model, EU Product Environmental Footprint Category Rules)
- Evaluated data quality and transparency criteria to distinguish between pilot-scale models and commercial production measurements
- Synthesized findings from battery manufacturers’ facility visits in China, European Commission benchmarking studies, and peer-reviewed scientific literature
Research Methodology & Data Synthesis
Conducted systematic synthesis of heterogeneous data sources with varying methodologies and reporting formats using Excel and Power Query:
Data Source Integration:
- Primary sources: Facility measurement data from commercial battery manufacturers (China, Europe)
- Secondary sources: Peer-reviewed LCA studies, industry technical reports, standardization benchmarks (GREET, PEFCR)
- Validation data: Historical pilot-scale estimates for calibration and variance analysis
Data Quality Assessment:
- Evaluated data reliability using transparency criteria (primary measurements > modeled estimates > theoretical calculations)
- Distinguished commercial-scale vs. pilot-scale sources to identify most representative data
- Validated consistency across energy balance calculations and material flow accounting
Data Standardization & Analysis:
- Standardized functional units across studies (kg CO₂-eq/kWh battery capacity) despite varying original reporting formats
- Harmonized system boundary definitions (cradle-to-gate) to enable cross-study comparisons
- Organized multi-dimensional analysis across: production stage, chemistry type, geographic region, energy source
This systematic approach to synthesizing fragmented research data required careful source validation, methodological standardization, and analytical rigor comparable to data integration challenges in industry settings.
Power Query Analysis & Chemistry Extrapolation
Used Power Query for data transformation and scenario modeling to extrapolate emissions impacts across battery chemistry variants:
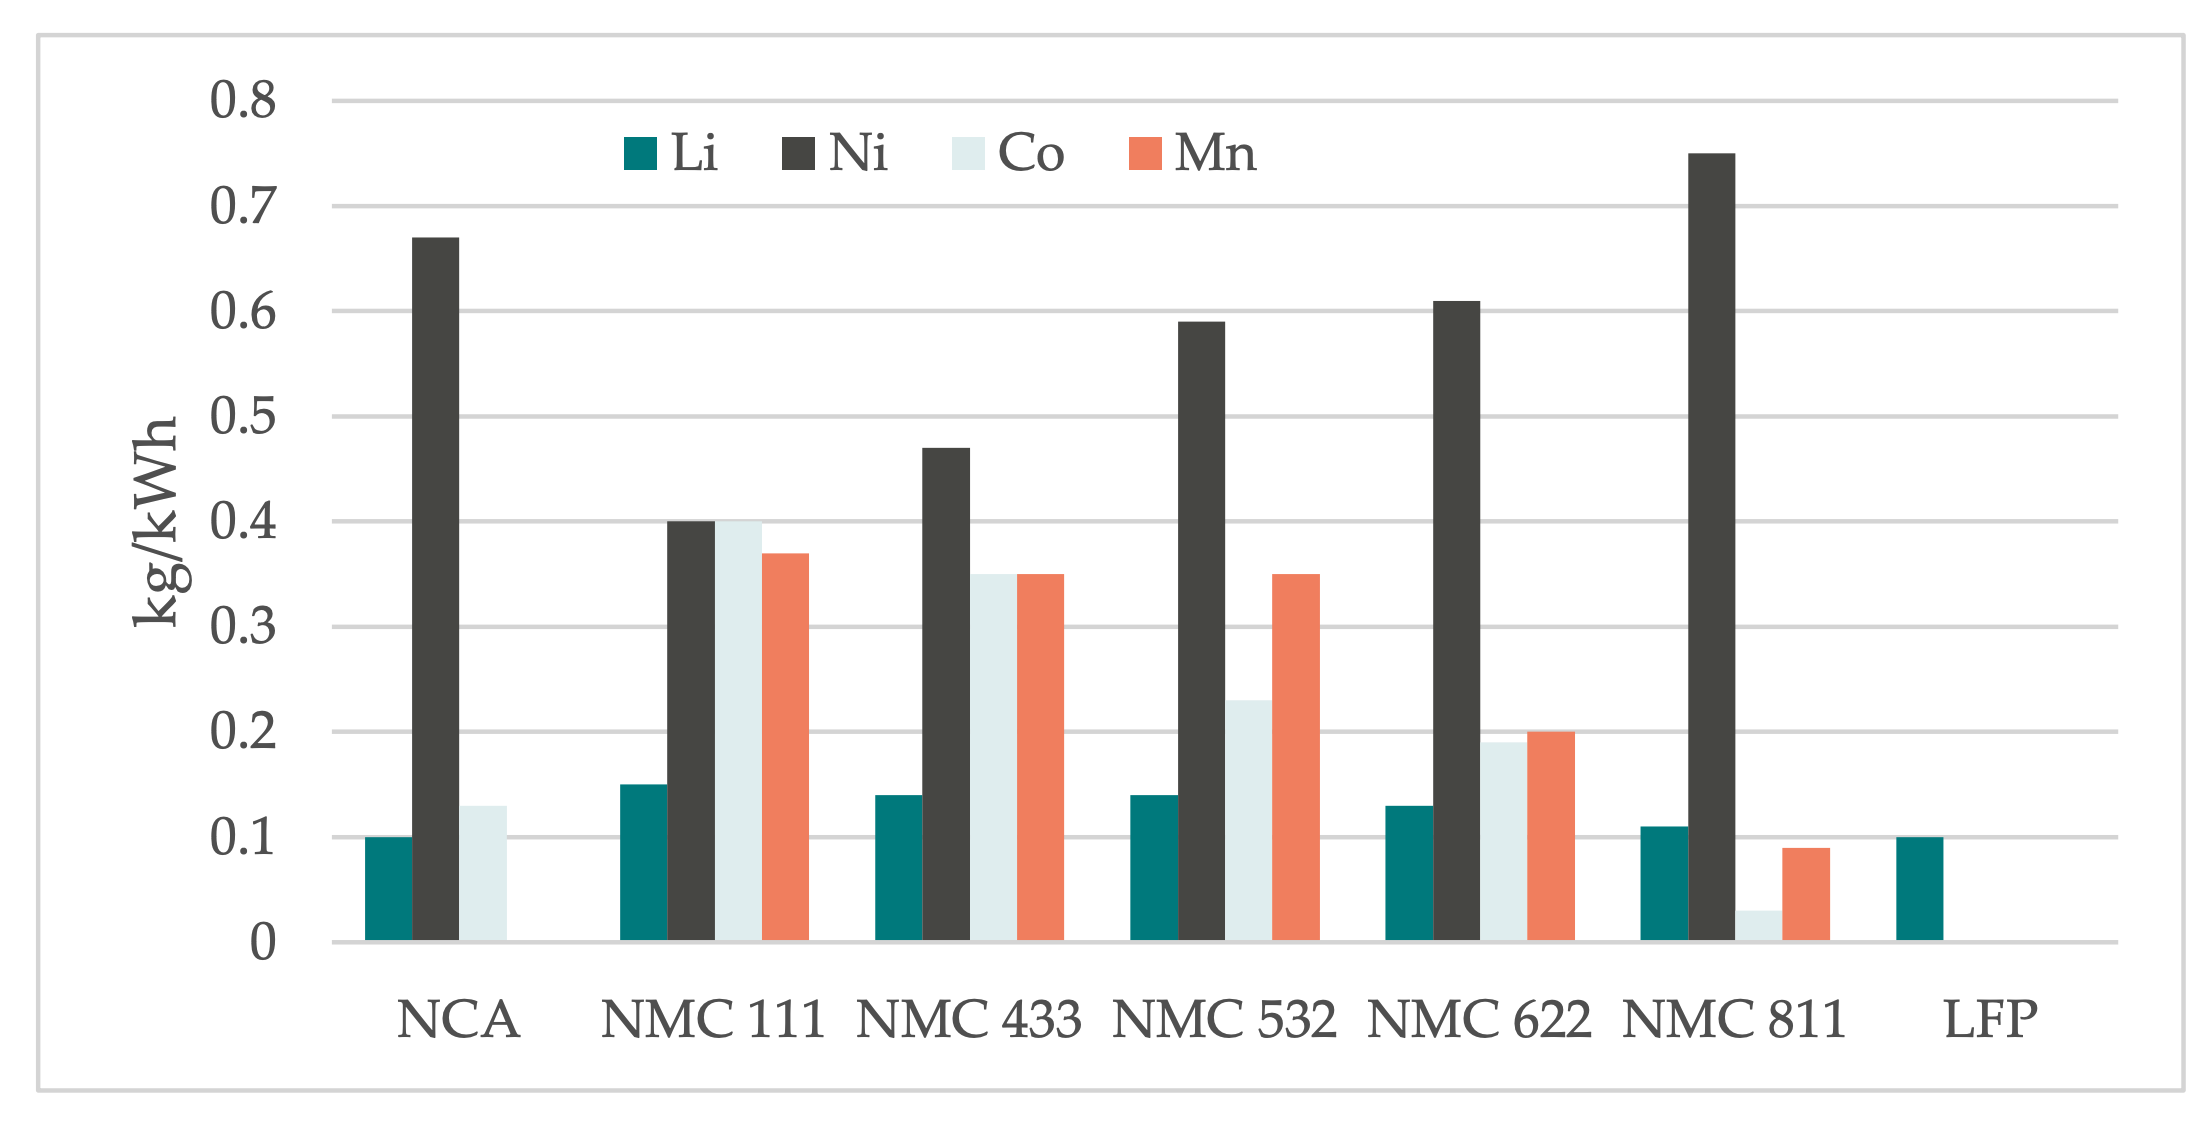
- Baseline: NMC 111 (equal parts nickel, manganese, cobalt) using primary commercial production data
- Projections: NMC 622 and NMC 811 (higher nickel content) using scaling factors based on:
- Energy density differentials between chemistries
- Material mass requirements per kWh capacity
- Process energy adjustments for different cathode compositions
This modeling approach enabled chemistry-specific CO₂ equivalent calculations without requiring separate facility measurements for each variant.
The Power Query analysis produced the following energy distribution breakdown, revealing that material production accounts for 72% of total energy consumption (NMC powder 37% + other materials 35%), while cell manufacturing represents 19%:
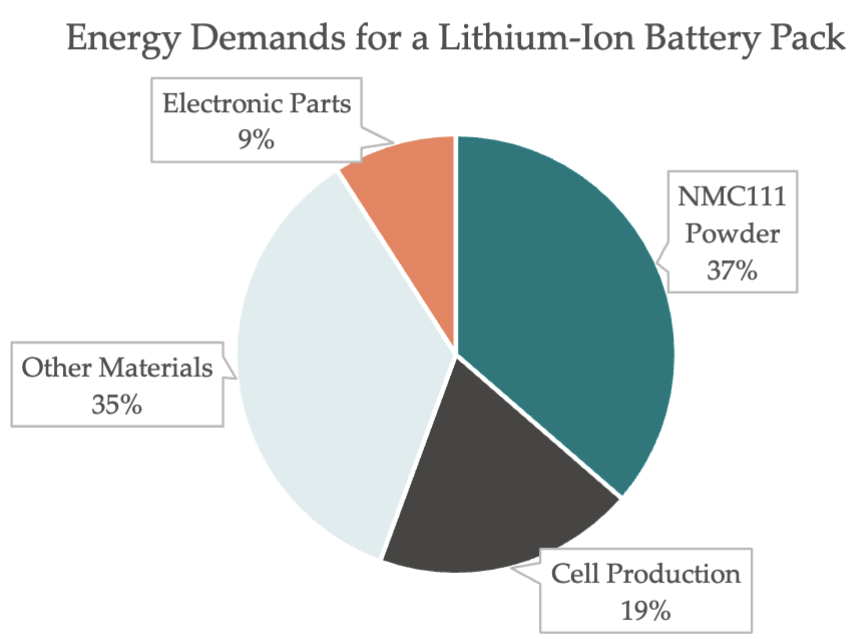
Energy Demands for Lithium-Ion Battery Pack - Analysis showing material production dominates total energy consumption
This distribution insight guided the subsequent deep-dive analysis into material production processes, particularly cathode powder manufacturing.
Energy & Emissions Modeling
Developed energy consumption breakdown models across production value chain:
- Mining/refining: 910 MJ/kWh
- Material production (cathode powder, co-precipitation, calcination)
- Cell manufacturing: 216 MJ/kWh (including dry-room operations)
Drill-down analysis into cathode powder production revealed critical process bottlenecks. The co-precipitation and calcination processes alone consume 43% of cathode production energy, highlighting a key optimization target:
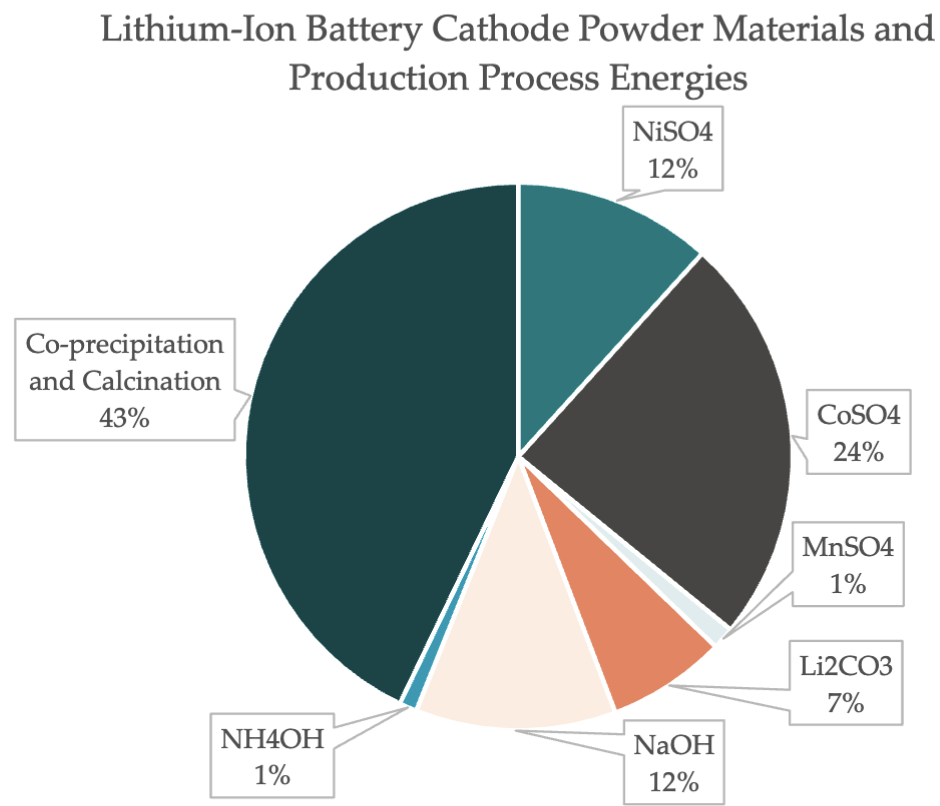
Cathode Powder Energy Breakdown - Process mining analysis identifying co-precipitation/calcination as primary energy consumer (43%), followed by cobalt sulfate production (24%)
This process-level granularity enabled targeted recommendations for efficiency improvements and informed the material-specific emissions analysis.
Scenario Modeling:
- Quantified sensitivity of carbon footprint to electricity mix variations (2-47 kg CO₂-eq/kWh range depending on renewable vs. fossil fuel sources)
- Analyzed geographic production scenarios (European vs. Chinese supply chains)
- Modeled chemistry transition impacts (NMC 111 → NMC 811)
3. Key Findings & Business Insights
Industry Maturation Impact
32-47% emissions reduction vs. 2017 estimates, driven by:
- Improved data transparency from commercial-scale facilities operating at 75%+ capacity
- Refined process energy measurements for dry-room operations and electrode drying
- Correction of overestimates in pilot-scale data (particularly NMP solvent evaporation)
- Documentation of actual production practices (water-based anode processing vs. modeled NMP use)
Chemistry Evolution Analysis
Power Query analysis revealed 14% CO₂ reduction potential from industry shift toward nickel-rich chemistries:
- NMC 811 projects 7% lower energy consumption than current NMC 111 standard
- Cobalt content reduction addresses supply chain concentration risks
- Trade-off: increased nickel demand may create new supply constraints
Supply Chain Risk Assessment
Analyzed critical material sourcing vulnerabilities:
- Cobalt: 17% artisanal mining in DRC, byproduct supply chain complexity
- Nickel: Emerging risk as demand increases with NMC 811 adoption
- Lithium: Potential periodic bottlenecks despite adequate global reserves
4. Strategic Implications
Geographic Production Scenarios
Scenario modeling quantified potential emissions variance based on electricity source:
- European scenario: 65 kg CO₂-eq/kWh (assuming renewable energy mix)
- Chinese scenario: 100 kg CO₂-eq/kWh (assuming coal-heavy electricity mix)
- Key finding: Electricity source accounts for 35-54% of total production emissions variance
Process Optimization Targets
Data-driven process analysis of cell manufacturing identified specific bottlenecks for efficiency improvements. Dry-room operations and electrode drying account for 82% of cell production energy, presenting clear optimization opportunities:
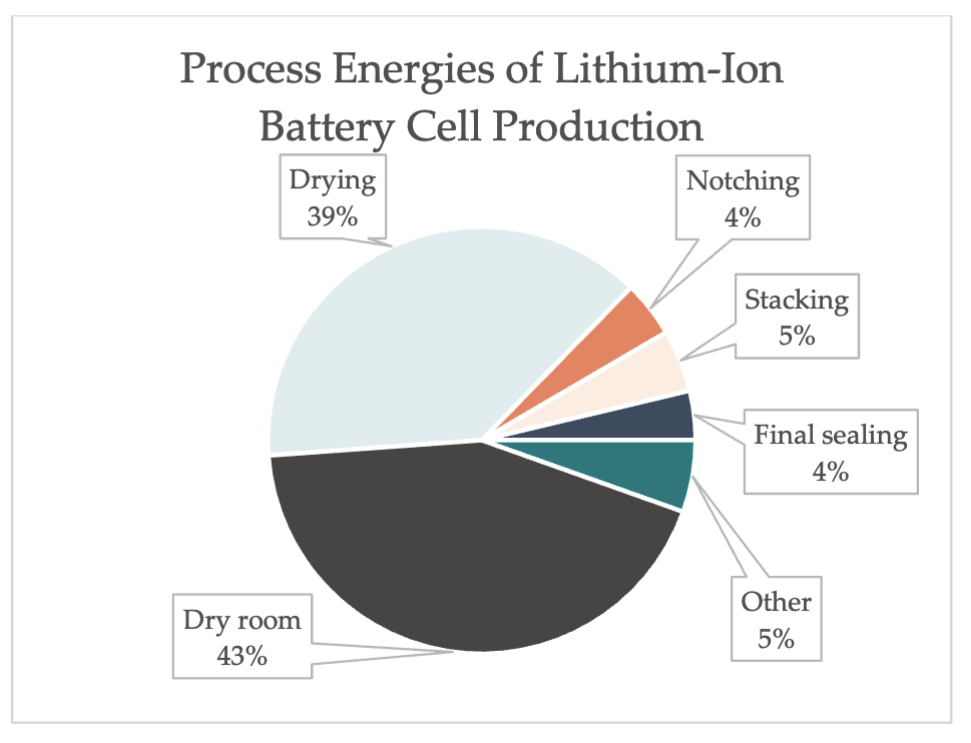
Cell Production Process Analysis - Performance analysis revealing dry-room (43%) and electrode drying (39%) as dominant energy consumers
Optimization Recommendations:
- Dry-room efficiency: Facility location selection based on climate (humidity/temperature impact on dehumidification energy)
- Electrode drying: Transition from NMP-based to water-based cathode slurries (45× energy reduction potential)
- Combined impact: Targeting these two processes alone could reduce cell manufacturing emissions by up to 40%
This granular process breakdown enabled facility design recommendations and technology roadmap prioritization for battery manufacturers.
Recycling Economics
End-of-life processing represents 12% of total battery lifecycle emissions (EU PEFCR data), emphasizing importance of efficient material recovery systems as production volumes scale.
5. Skills Demonstrated
Data Analysis & Research Methodology:
- Multi-source data synthesis: Harmonized 15+ heterogeneous data sources with varying methodologies, units, and system boundaries
- Data quality assessment: Evaluated source reliability using transparency criteria, distinguishing primary measurements from modeled estimates
- Excel & Power Query: Data transformation, aggregation using M-code and DAX, scenario modeling across chemistry variants
- Multi-dimensional analysis: Organized data across production stage, chemistry type, geographic region, and energy source dimensions
- Data standardization: Normalized functional units (kg CO₂-eq/kWh), harmonized reporting formats, validated energy balance calculations
- Sensitivity analysis: Quantified variance across multiple input parameters (chemistry, geography, energy mix)
Analytical Problem-Solving:
- Decomposition analysis: Drill-down from value chain → production stage → sub-process level to identify energy bottlenecks
- Comparative benchmarking: Analyzed commercial-scale vs. pilot-scale efficiency to identify data quality patterns
- Metric standardization: Defined standardized KPIs (kg CO₂-eq/kWh) for cross-study comparability
- Validation & verification: Cross-checked energy balance calculations and material flow accounting for consistency
Business Analysis:
- Industry trend analysis: Quantified 32-47% efficiency improvement from industry maturation
- Supply chain risk modeling: Geographic concentration analysis (cobalt in DRC, emerging nickel constraints)
- Optimization roadmapping: Prioritized process improvements by energy impact (dry-room 43%, drying 39%)
- Strategic sourcing: Chemistry transition recommendations balancing performance vs. material availability
Communication & Impact:
- Technical writing for government agency stakeholders and academic peer review
- Translation of complex analytical methodology into actionable business insights
- 21,500+ downloads and 114 citations demonstrating research impact in electromobility industry
Download Publication
The full research report is available for download:
Download Full Report (PDF)
Citation: Emilsson, E., Dahllöf, L. (2019). Lithium-Ion Vehicle Battery Production – Status 2019 on Energy Use, CO₂ Emissions, Use of Metals, Products Environmental Footprint, and Recycling. IVL Swedish Environmental Research Institute. Report C444.