Optimizing European Battery Recycling Through Data-Driven Location and Technology Analysis
Impact at a Glance
Addressed Europe’s projected 98,667 annual tonnes battery recycling capacity gap through optimization modeling, recommending a single H2SO4 facility in Germany as the most cost-effective solution.
1. Business Problem
Facility developers planning €50M+ battery recycling infrastructure investments by 2030 face critical location and technology selection challenges. Suboptimal decisions risk €100-430M in unnecessary lifecycle costs from inefficient logistics, competitive disadvantages from poor geographic positioning, and missed opportunities from inadequate market intelligence.
This project, part of the EU-funded ELiMINATE research project, analyzed 27 EU countries and 98,667 annual tonnes of battery recycling capacity to deliver a data-driven framework addressing three questions: Where to locate facilities, which recycling technology to deploy, and how competitor positioning affects these decisions. Full research documented in the EU project report.
2. Approach
As lead of Work Package 3B (Material Flow Analysis - EU Context), I developed the optimization modeling framework and European market analysis, collaborating with co-author Ayse Nur Ozturk who conducted the technoeconomic analysis (facility CAPEX/OPEX calculations). The work combined market intelligence, optimization modeling, and competitive analysis:
Data Collection: Scraped open-source battery bill-of-materials data to estimate volumes and geographic coordinates for battery actors across Europe. Integrated country-level cost and CO2 emissions data from industry analysts and LCA experts.
Optimization Model: Used Python (Pandas, PuLP) to model facility location, technology selection, material routing, and capacity sizing. Evaluated three recycling technologies (H2SO4, MSA, H2SO4-NMC) across facility costs, emissions, transportation, and processing efficiency. Tested sensitivity to regulatory uncertainty by varying transportation costs between low and high hazardous waste classification scenarios.
Competitive Analysis: Built Power BI dashboard analyzing competitor capacity evolution (2022-2030) and geographic clustering across 27 EU countries.
For readers interested in the technical implementation, the complete optimization formulation is available below:
3. Results and Business Value
Optimal Configuration: Single H2SO4 facility in Germany provides lowest total cost across all scenarios. For all three technologies evaluated, economies of scale favored centralized (one facility) over distributed networks, regardless of transportation cost assumptions.
Competitive Intelligence: Central Europe shows high recycler concentration (fierce competition, margin pressure), while Northern Europe presents a second cluster with differentiation opportunities. Dashboard enables tracking of competitor capacity expansion and market entry timing analysis.
Regulatory Sensitivity: Lower transportation costs shift optimal locations for MSA and H2SO4-NMC technologies to Northern Europe, highlighting how hazardous waste classification rules impact multi-million euro facility placement decisions.
Project Impact: The analysis reduces capital allocation risk for facility developers, reveals geographic opportunities for existing operators, and supports EU regulatory compliance targets by addressing the 98,667 tonne capacity gap with cost-efficient placement.
4. Key Visualizations
The following color scheme is used throughout the network visualizations:
Supply and Demand Network (2030)
Geographic distribution of 98,667 tonnes projected battery recycling demand across 27 EU countries, with existing and planned recycler capacity. Central Europe emerges as the optimal hub due to concentration of battery production in Germany, France, and Poland, minimizing weighted transport distances.
Interactive map showing 98,667 tonnes of battery recycling demand and capacity across 27 EU countries
Material Flow Analysis
Visual representation of battery material flows through the recycling system, showing how materials move from collection points through processing facilities to final outputs. The Sankey diagram illustrates the scale and efficiency of material recovery pathways.
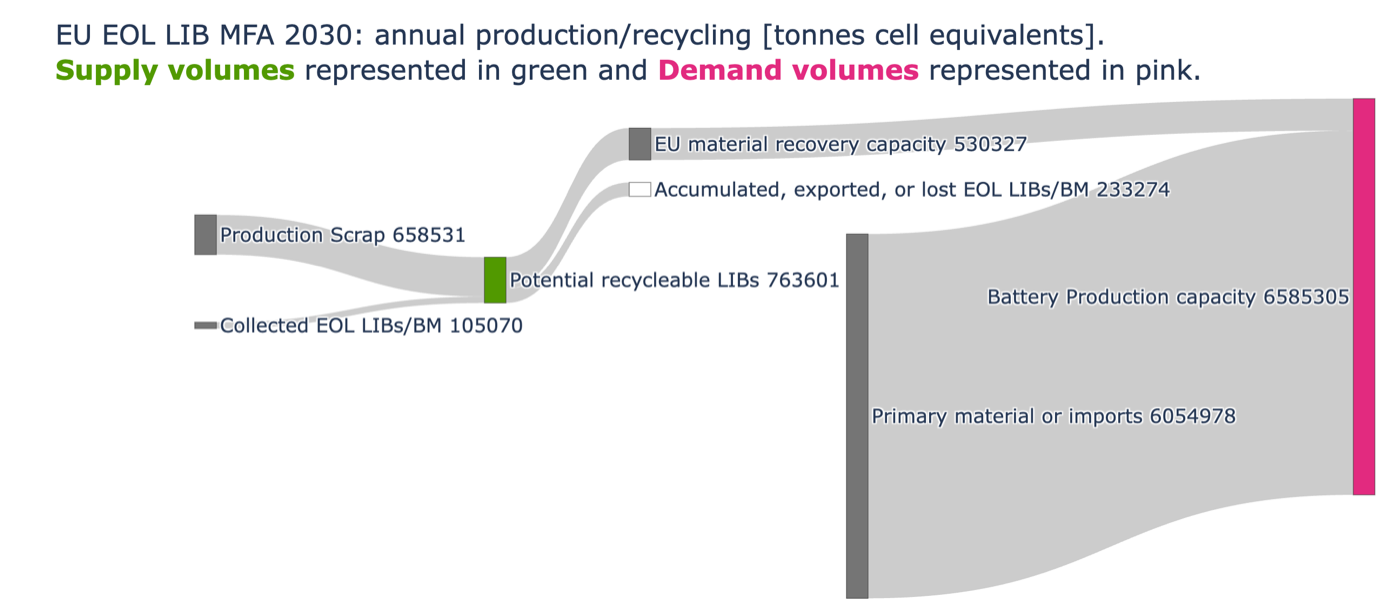
Sankey diagram visualizing battery material flows through the European recycling network
Cost Analysis Across Technologies
Comprehensive cost optimization reveals H₂SO₄ technology can achieve €700M in cost savings compared to less optimal technology choices (€1.06B vs €1.76B total lifecycle costs) while demonstrating superior resilience to transport cost volatility. The cost-optimal network configuration favors centralization—a single strategically-located facility maximizes economies of scale.
A parallel CO₂ emissions optimization reveals fundamentally different network requirements: while cost minimization favors centralized processing (one facility), emissions reduction demands distributed networks with four facilities across the Nordics and Germany. Optimal technology and location choices can reduce emissions by up to 529,000 tonnes CO₂ annually—H₂SO₄-NMC technology achieves the lowest emissions (7,012 tonnes CO₂) compared to worst-case scenarios (536,013 tonnes), though this requires 10-30% higher capital costs compared to the cost-optimal configuration.
Implementation Code
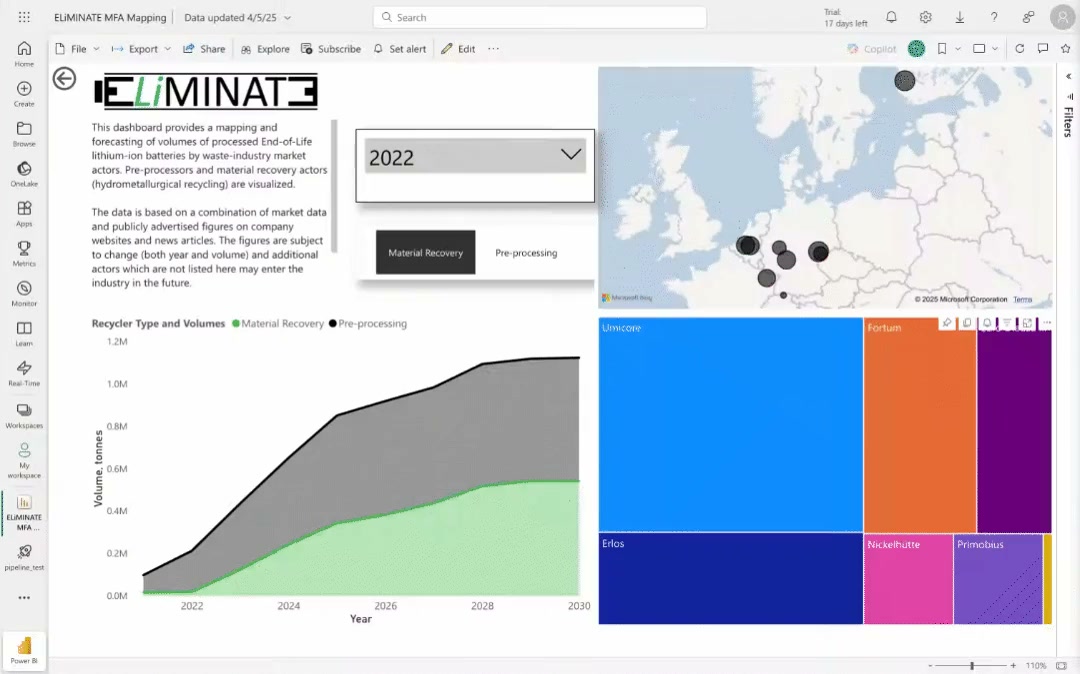
Competitor Intelligence Dashboard
Power BI dashboard tracking competitor capacity evolution (2022-2030) with geographic clustering. Reveals Central Europe’s fierce competition and margin pressure versus Northern Europe’s differentiation opportunities. Interactive features enable company-specific benchmarking and market entry timing analysis.
5. Skills Demonstrated
Optimization & Modeling: Linear programming for multi-criteria decision analysis (cost, emissions, capacity, location) with scenario sensitivity testing
Competitive Intelligence: Market landscape mapping, capacity forecasting, and geographic clustering analysis
Data Engineering: Web scraping, data integration from multiple sources, geospatial analysis across 27 countries
Business Communication: Power BI dashboards and Plotly visualizations translating technical analysis into executive decision-support tools
Relevant to supply chain network design, facility location planning, logistics route optimization, and sustainability strategy roles across manufacturing, cleantech, and consulting sectors.