OEM Material Insights: Procurement & Supply-Risk Intelligence on Microsoft Fabric
About this project
This is a self-directed portfolio project, not a client engagement. That distinction changes how the numbers on this page should be read, so it belongs at the top rather than in a footnote.
| Data source | Provenance |
|---|---|
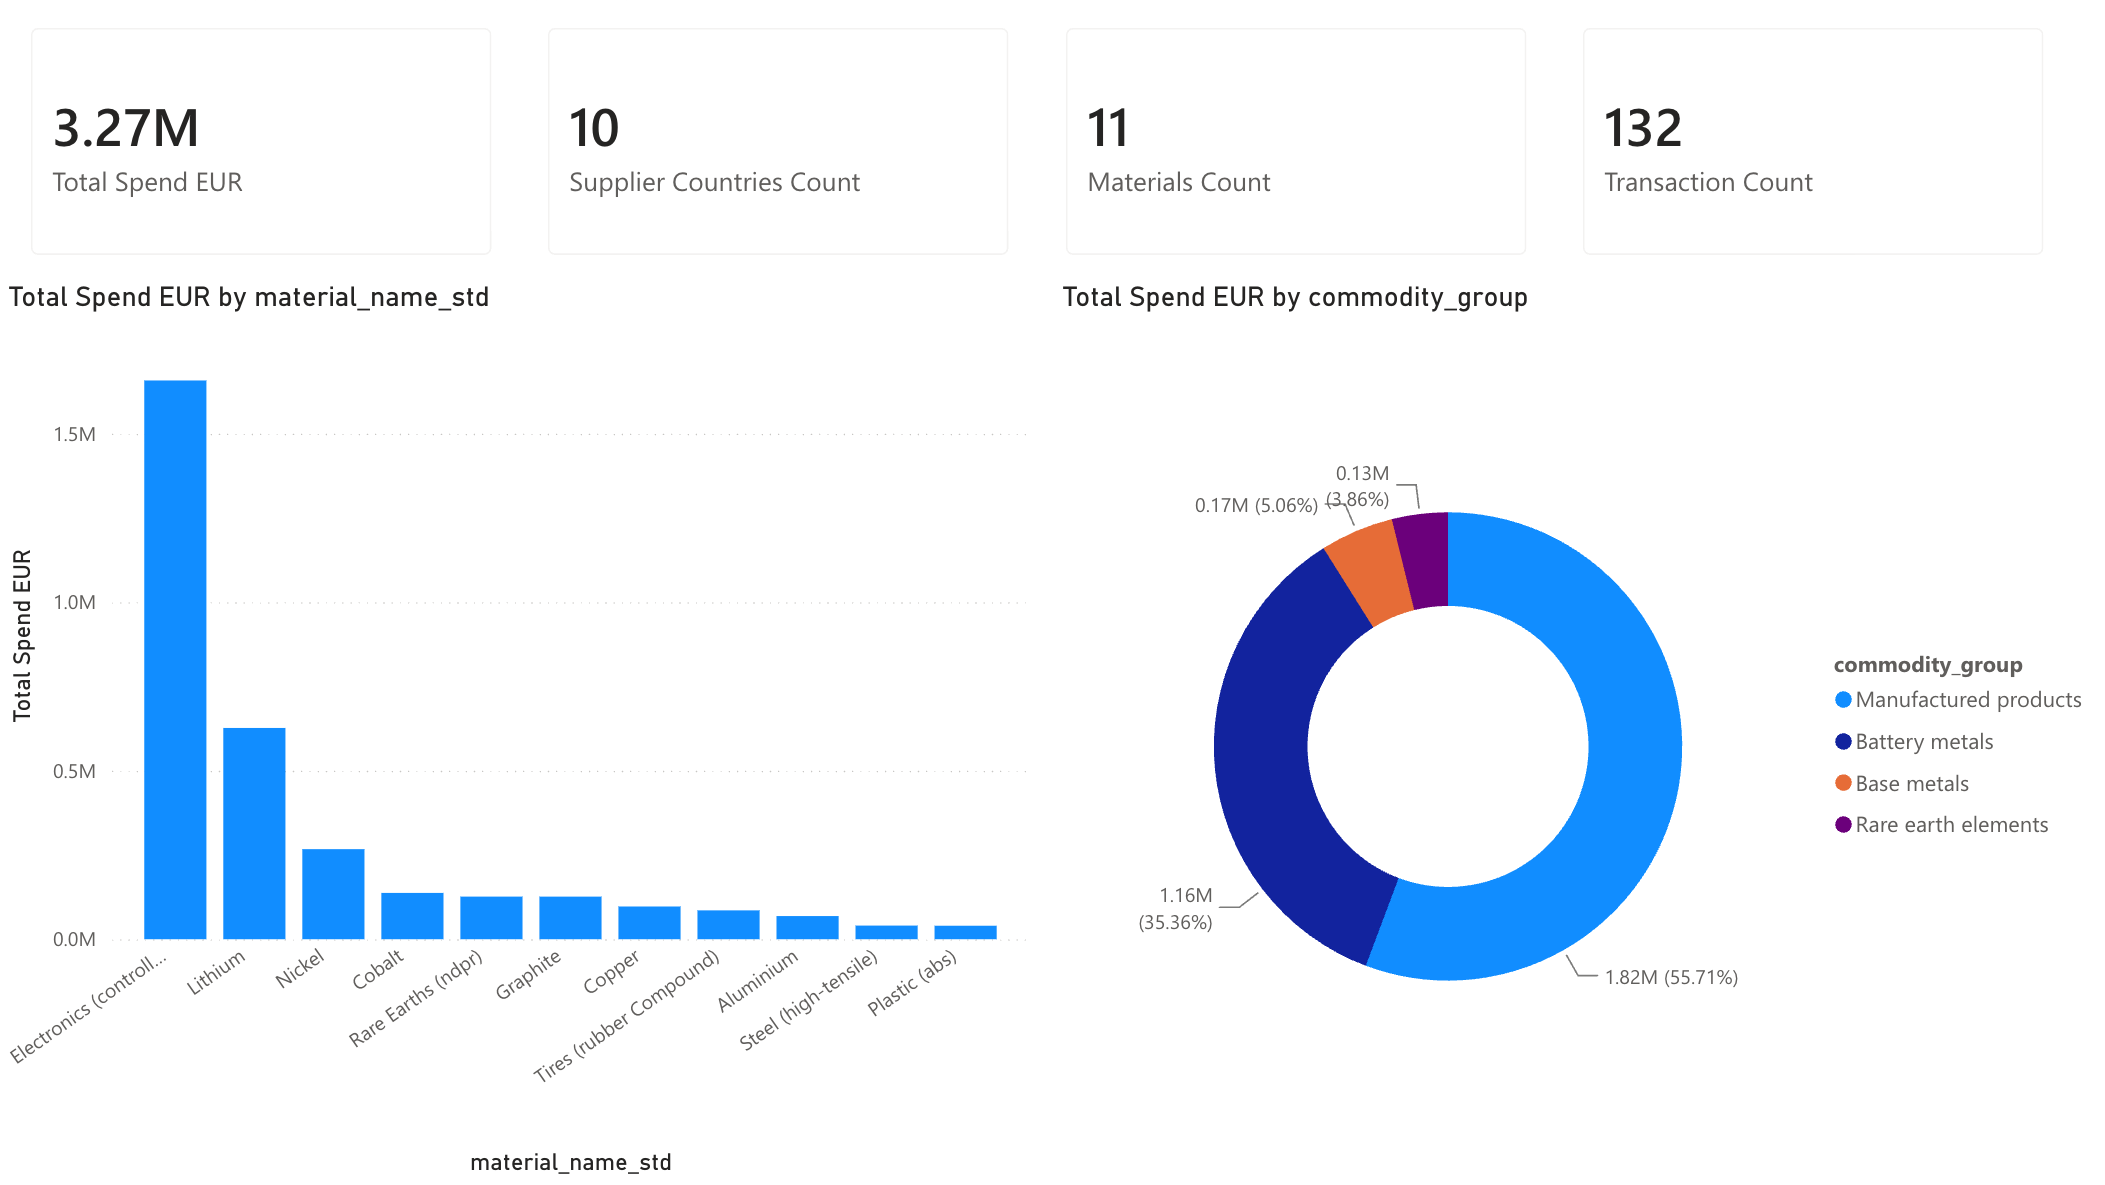
| Procurement ledger | Synthetic, generated for this project (132 transactions, 11 materials, 10 supplier countries) |
| Environmental Performance Index (Yale) | Real public dataset, automated HTTP ingestion (180 countries) |
| Worldwide Governance Indicators (World Bank) | Real public dataset via the World Bank API (~200 countries × 6 dimensions) |
| Critical-raw-material supply shares (EU CRM study) | Real public dataset (80+ materials × 2 stages) |
The risk methodology and every external input are real; the spend figures are illustrative. So this project makes claims about method and engineering, not about discovered business facts. Any “insight” drawn from a synthetic ledger would be an artifact of the generator, and presenting one as a finding would be dishonest.
The question
Procurement organisations generally know what they spend and with whom. What they usually cannot answer:
- Is our sourcing concentrated? Not “which supplier is biggest”, but the economically meaningful question: how concentrated is the upstream supply of the materials we depend on?
- Is that concentration somewhere risky? A 60% share from a well-governed country is not the same risk as 60% from a poorly-governed one.
- Is our exposure worse than the world’s? If Europe sources a material more narrowly than global production is distributed, that is a distinct and actionable risk.
- How much of the answer is missing? Every real dataset has coverage gaps, and a risk index that quietly treats “no data” as “no risk” is worse than no index at all.
Question 4 drove most of the engineering below.
Architecture
A medallion lakehouse orchestrated by a single Fabric Data Pipeline of 10 activities, on a daily schedule.
- Bronze: four Copy activities (Azure SQL, supply-share CSVs) plus two PySpark notebooks that fetch EPI over HTTP and WGI from the World Bank API directly. No manual file uploads.
- Silver: one PySpark notebook for type coercion, date correction, unit normalisation to kilograms, and country/material alias resolution with confidence scoring.
- Gold: a star schema (3 facts, 5 dimensions) plus the weighted risk model, read by a DirectLake semantic model of 14 tables, 10 relationships and 45 measures.
- Quality: a terminal notebook that persists check results and can halt the pipeline, plus an error handler that runs on every outcome.
Incrementality lives in silver, not bronze: bronze is a full load, and a p_from_date parameter drives a seven-day look-back against corrected dates. That is a deliberate simplification at portfolio scale, and worth stating rather than implying a more elaborate design than exists.
The engineering decisions worth defending
The governance weight has to be inverted, or the index ranks risk backwards
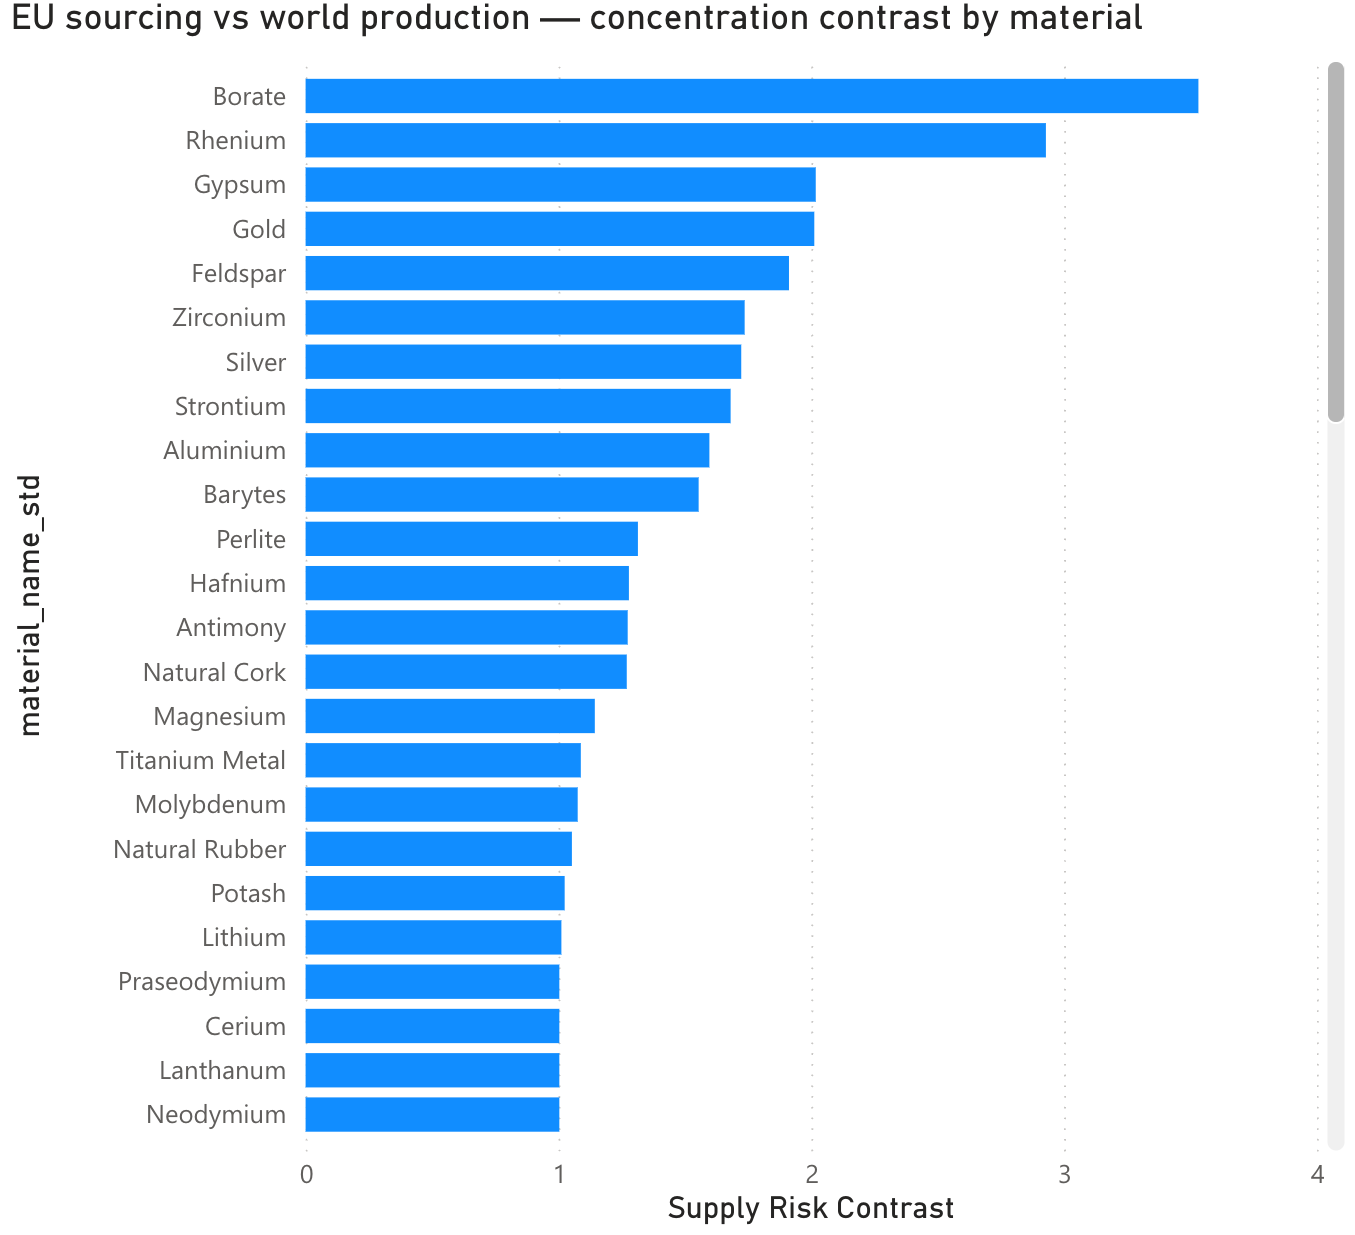
Supply risk is a governance- and trade-weighted Herfindahl index, computed per material × stage × year. Raw World Bank governance estimates run roughly −2.5 to +2.5, where higher means better governance. Used unmodified as a multiplier, the index rewards poorly-governed sourcing, so the weight is rescaled and inverted so that 1 means worst.
This is the interesting bug precisely because an un-inverted index still computes, still returns plausible numbers of the right magnitude, and still renders fine in a report. Nothing errors. Every ranking is simply upside-down. No test catches it except knowing the sign convention of your source data. That is exactly the class of defect that reaches production.
Rescale on fixed theoretical bounds, not observed min/max
The rescaling divisor is the governance scale’s theoretical range, not the observed range of whichever countries happen to be loaded. With observed bounds, adding one country (or ingesting a new data vintage) silently re-ranks every material, and before/after comparisons across runs become meaningless. Fixed bounds make the index reproducible across runs and vintages.
NULL is not zero
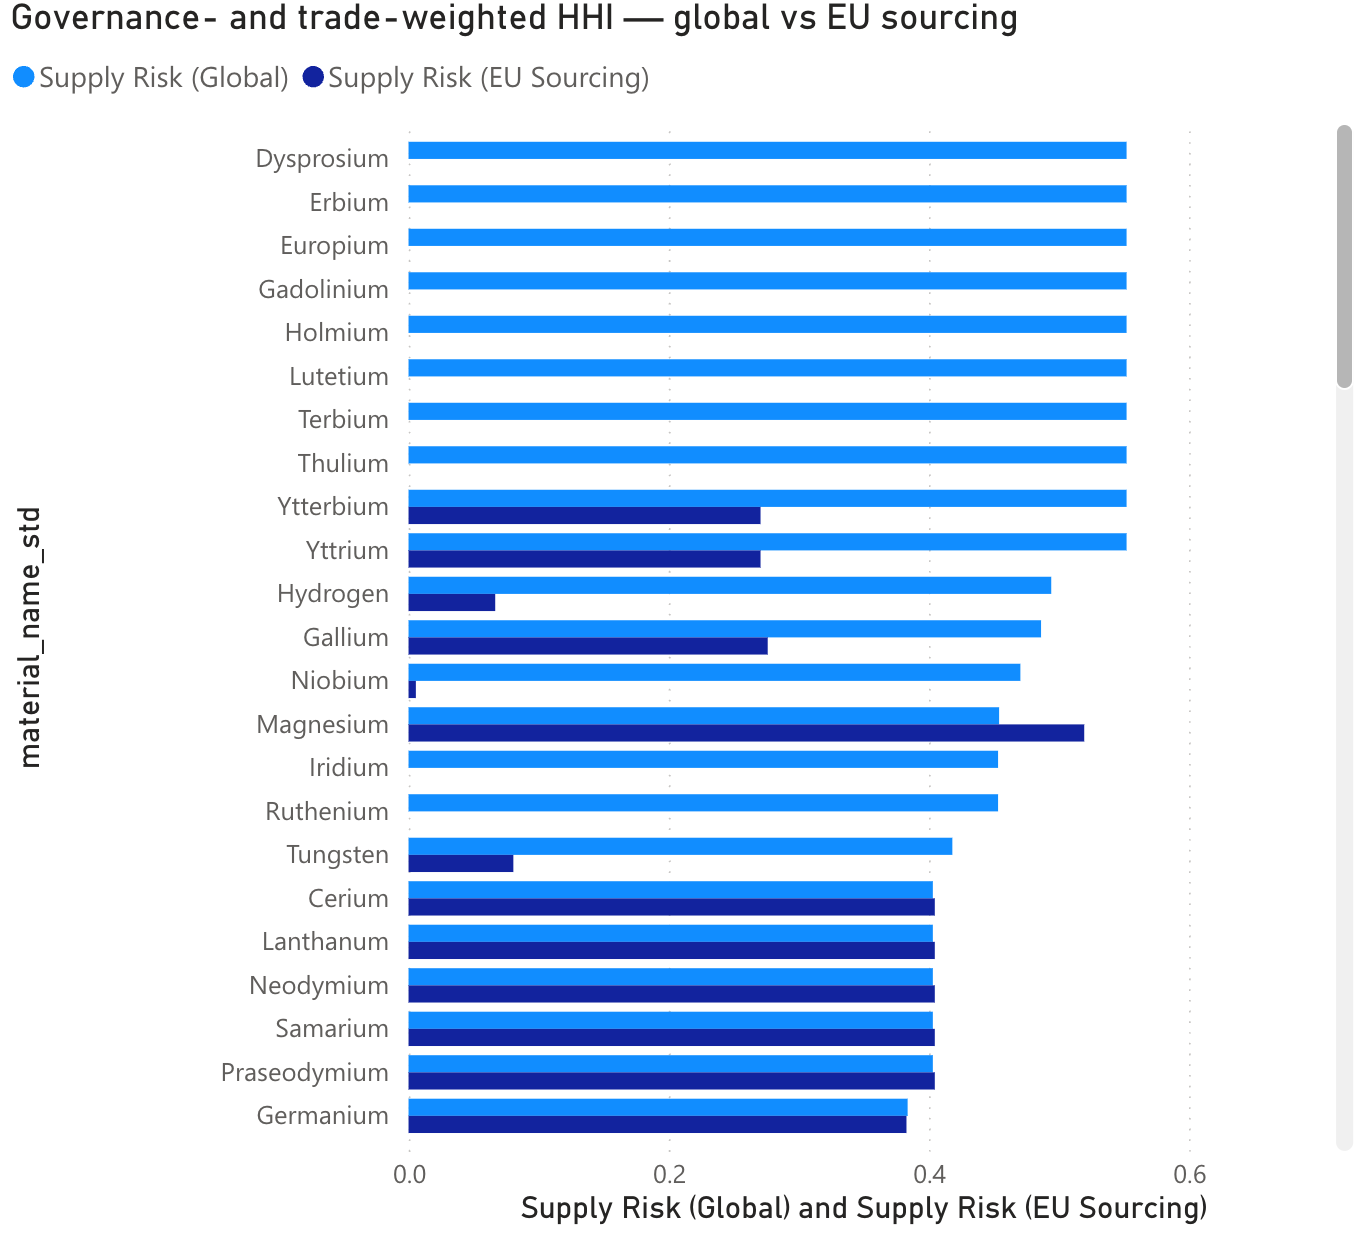
A material and stage with global supply data but no EU sourcing rows yields a BLANK contrast, never 0.
This matters because 0 is a legitimate value in this index: it means perfectly diffuse supply, no concentration risk. Coercing a coverage gap to 0 does not merely lose information, it inverts the meaning, reporting the safest possible reading for the case where you know least.
The effect is visible in the report, which is the useful thing about making the decision structural rather than documentary.
Taiwan is a permanent, documented gap, not a bug to fix
While building the governance join, a coverage audit flagged Taiwan as having no governance data. The instinct is to treat this as an aliasing failure and go hunting for the alias.
It isn’t one. The World Bank publishes no governance indicators for Taiwan and never has, because Taiwan is not a member state. No alias mapping will resolve it.
The correct response was to stop trying to fix it and make it visible instead: an incomplete_wgi_coverage flag on the affected rows, so that materials with meaningful Taiwanese supply are known to have an understated risk score rather than a wrong one presented as complete. Semiconductor-adjacent materials are exactly where this bites.
This is the decision I would most want to be asked about, because the tempting alternatives (drop the country, impute a regional average, coerce to zero) are all defensible-sounding and all wrong in a different way.
The blocking gate and the breach flag are different signals
Quality checks are not advisory. The terminal data_quality_checks notebook raises an exception when any check in a fixed 13-entry blocking set fails: schema validation, required-field completeness, duplicate detection, referential integrity at zero tolerance across all three gold facts, and grain uniqueness. The exception is raised after results are persisted, so a blocked run still leaves a complete audit trail rather than failing dark.
The subtle part: a separate breach_flag tracks a score threshold and is advisory only, and the two diverge routinely. A grain-uniqueness failure on 2 rows out of 2,561 scores about 99.9, far above the breach threshold, yet halts the pipeline. A run can record zero breaches and still be a blocked run. Reading breach_flag to decide whether the gate passed reads the wrong field entirely, so the gate writes its own explicit verdict rows.
Duplicated logic, pinned by contract instead of left to drift
Fabric notebooks cannot import from the repository’s src/ package at runtime, so transformation logic necessarily exists twice: inline in the notebook (what actually runs) and in src/transformations/ (what is testable).
Rather than pretend one is the source of truth, the duplication is made a tested contract: the suite loads the notebook’s own functions and pins them against the module implementations. Where semantics intentionally differ, the difference itself is asserted rather than quietly reconciled. Changing one side without the other fails CI by design. 329 tests run against this arrangement across Python 3.10–3.13.
Data quality as an observable system
Quality is modelled as gold tables that accumulate over time, not as a pass/fail printout. Of the model’s 45 measures, 17 sit on this layer:
- Run history: per-check results per run, so quality is a trend rather than a snapshot
- Gap registry and coverage tables: what is missing, and where coverage is incomplete
- Low-confidence and unmapped audits: alias resolutions that matched weakly enough to warrant review
Country and material names arrive inconsistently across four independent sources: “USA” against “United States”, “Copper Wire” against “Copper, refined”. Resolution is alias mapping plus confidence scoring, with every low-confidence and unmapped value written to an audit table instead of being dropped or silently force-matched.
Fourteen check functions run per pipeline execution. The payoff of storing rather than printing them is visible over months: coverage started at 85%, climbed as the alias mappings landed, and has held near 99% since February. One run’s score could not tell you whether a number was stable or merely lucky.
Deployment
Automated deployment through GitHub Actions and Microsoft’s fabric-cicd library: service-principal authentication with secrets held in GitHub and never committed, a parameter.yml for environment-specific rebinding, publish on merge to main, and a dry-run mode that reports the deployment plan without publishing.
One honest note carried in the workflow itself: fabric-cicd exposes no public dry-run API at the pinned version, so that path calls private helpers. The coupling is documented at the call site with an explicit upgrade trigger, and degrades to a warning rather than a hard failure if the helpers are renamed. Documenting a known limitation precisely beat both pretending it wasn’t there and blocking indefinitely on an upstream release that may never come.
Performance
Measured over warm-cache incremental runs rather than estimated:
| Stage | Wall clock | Share of chain |
|---|---|---|
| Bronze (6 activities, parallel) | 74 s | 7% |
| Silver | 142 s | 13% |
| Gold + quality checks | 844 s | 80% |
| Functional total | 1,060 s |
One stage accounts for roughly 60% of the entire chain on its own, which makes it the unambiguous optimisation target. Bronze parallelism means the six ingestion activities cost only their slowest member, not their sum. No SLA or throughput target is claimed for this project.
Scope boundaries
Stated because a risk model without stated boundaries is a liability:
- Gross supply risk only. No recycling or substitution adjustment. These are not official EU CRM Supply Risk values and must not be labelled as such.
- Governance coverage is incomplete for non-member states, permanently. Affected rows are flagged, and their risk is understated by construction.
- The procurement ledger is synthetic. No business conclusion should be drawn from the spend figures.
- Supply shares are an annual snapshot;
"<1%"source values are treated as 0.5% midpoint estimates. - Bronze is a full load. Incremental behaviour applies to silver and gold only.
- Portfolio scale. Nothing here has been load-tested.
What I would do differently
- Profile the source data before writing alias maps. Most of the alias work was reactive; an upfront profiling pass would have surfaced the same mismatches faster and produced the mapping table as a by-product.
- Decide the notebook/module duplication policy on day one. Making it an asserted contract was the right answer, but it was reached after the drift had already appeared.
- Establish the performance baseline earlier. Optimisations were chosen partly on intuition before the measurement existed; the measurement then showed one stage dominating, which would have redirected the earlier effort.
- Treat coverage gaps as a first-class design input, not a late discovery. The Taiwan case reframed how the whole index handles missing data. That lesson should have arrived at design time.
Resources
- OEMMatInsightBI on GitHub: full source for the medallion lakehouse, PySpark transformations, and the pytest suite that runs in GitHub Actions
- Yale Environmental Performance Index: environmental data source
- World Bank Worldwide Governance Indicators: governance data source
- EU Critical Raw Materials datasets: cleaned supply-share data